About Financial Board
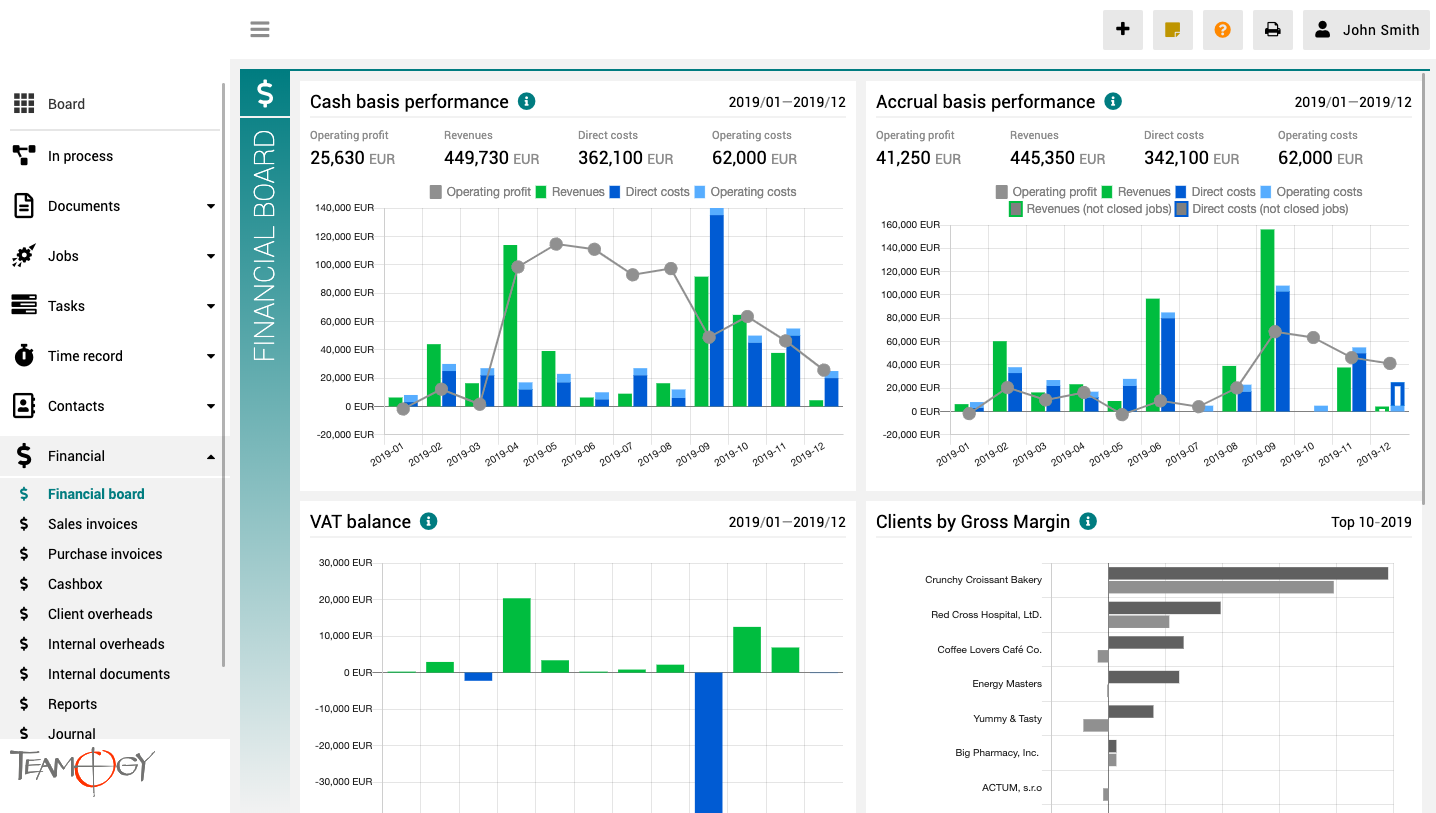
The finance board is a place that provides a clear view of the entire company. It contains charts with key indicators – overall evolution of revenues and costs of the company, according to financial and Job aspects, various views on client profitability and efficiency, and VAT report.
All charts have the option to select a date period while client reports also have the option to monitor the best and worst ranked clients.
O Timesheecie
Versión 2.16
Que es nuevo en la versión 2.16?
Funcionalidad principal: Comentarios
Mejoramientos: Tareas en Trabajo, Firma, Mejor Exportación de Trabajo, Buscar por ID de compañía, Pestañas Editables, Referencia de Contraparte/Número de factura
Version 2.15
What is new in 2.15 version?
Major Functionality: Stopwatch
Improvements: Composing documents from selected job items, New column in job table, Job Item creation driven by Quotation status
Bug fixes: Charts calculate also with operation billings
About Frequent Bad Habits
About Frequent Bad HabitsAlmost every company has some bad habits. We tried to describe some of them and at the same time to show them on graphic reports where they can be easily detected.Get in Touch If you have problem or need further assistance, do not hesitate...
Jobs Are Not Closed Correctly
Jobs Are Not Closed Correctly The job is the basis of all operations at the company - it includes an approved quotation for the client, purchase orders placed to suppliers and Tasks for the internal team. All financial documents are related to the Job - it contains...
Cash Basis Performance
Cash Basis PerformanceCash basis performance helps to track company financial performance based on Revenues and Costs. This chart shows Revenues (green bar) and Costs (blue bar) for the selected months. The chart locates both Revenues and Costs into the period...
Not All Operating Costs Are Entered
Not All Operating Costs Are Entered Every company needs to manage not only Jobs but also operating costs. It is a great advantage to have everything in one system and have actual compay results immediately available. Often, the compay’s owners and management will...
Accrual Basis Performance
Accrual Basis PerformanceAccrual basis performance helps to track company performance based on Jobs, Client Overheads, and Internal Overheads. This chart shows Revenues (green bar) and Costs (blue bar) for the selected months. The chart locates both Revenues and Costs...
Monthly Operating Costs Planning
Expense Forecast - Monthly Operating Costs PlanningThe overheads of the entire company can be planned clearly from one place, even by month. Model your expected company expenses by specific items or groups and collaborate with selected colleagues to plan them. Once...
Clients by Gross Margin
Clients by Gross Margin This chart shows client ranking by Gross Margin and also shows Gross Profit as additional information. Client Gross Margin is represented by the dark grey bar. Client Gross Profit is represented by the light grey bar. Gross Margin is...
Get in Touch
If you have problem or need further assistance, do not hesitate contact Teamogy Support. Use online chat (inside Teamogy or everywhere on www.Teamogy.com in the lower right corner) and you will get prompt reply.