About Financial Board
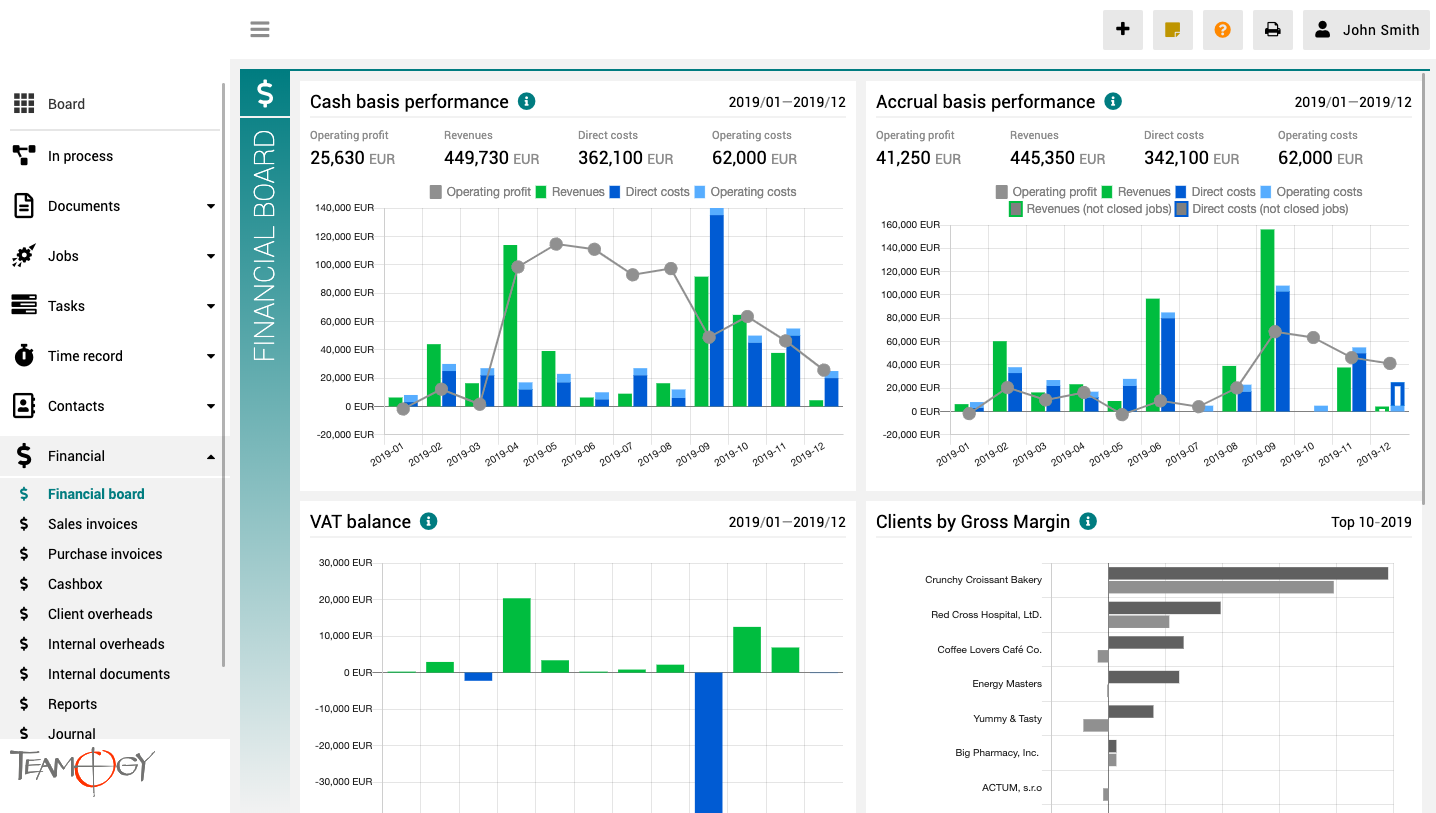
The finance board is a place that provides a clear view of the entire company. It contains charts with key indicators – overall evolution of revenues and costs of the company, according to financial and Job aspects, various views on client profitability and efficiency, and VAT report.
All charts have the option to select a date period while client reports also have the option to monitor the best and worst ranked clients.
Clients by EHP
Clients by EHP This chart shows client rankings by Effective Hourly Payroll. This is a perfect criterion for measuring real client profitability. Effective Hourly Payroll is calculated per client as Gross Margin divided by Recorded Hours in a selected period and is...
Version 2.14
What is new in 2.14 version?
Major Functionality: Financial Board
Improvements: Search in Breadcrumbs, Dropdownable in Time Recorder, Task Report, User Area Changes
Bug fix: Proforma fix, Better job table print
Výkony bez časového omezení
Cash Basis PerformanceVýkony bez časového omezení umožňují sledovat finanční výkonnost agentury na základě Klientských a Dodavatelských faktur. Tento graf zobrazuje Tržby (zelený pruh) a Náklady (modrý pruh) pro vybrané měsíce. Šedivá linka znázorňuje Vývoj...
Clients By Recorded Hours
Clients by Recorded Hours This chart shows client ranking by the number of Recorded hours. This chart tells you which clients use your agency people the most. Effective Hourly Payroll is used as additional information – you can double-check if the most served clients...
Financial Terminology
Financial TerminologyNumbers, reports and their correct interpretation are the key to successful company management. Therefore, it is very important to understand what each number means. We have put together a table that clearly explains the financial terms used in...
Create A Task From View II
Create A Task From View IIWe have offered you fast ways to use the Teamogy. We have another fast way to create a task for you. Check the GIF below to get you know, how to create a task really fast. First, go to the task statuses view and then follow our guide.Complete...
VAT Balance
VAT Balance This chart shows the VAT Balance – the difference between the VAT on Sales Invoices and the VAT on Purchase Invoice. The positive column (green bar) shows the obligation to pay the VAT – the situation when your VAT on Sales Invoices (Output VAT) exceeds...
O Projekcie
Nowy Timesheet dla wybranego Jobu / Zadania / Budżetu
VAT Report
VAT ReportThe VAT report shows the VAT values from Sales and Purchase invoices and provides useful information about the amount of the VAT obligation (deduction) for each month. The VAT report contains the individual financial documents (Sales and Purchase invoices)...
Get in Touch
If you have problem or need further assistance, do not hesitate contact Teamogy Support. Use online chat (inside Teamogy or everywhere on www.Teamogy.com in the lower right corner) and you will get prompt reply.