O Pulpicie finansowym
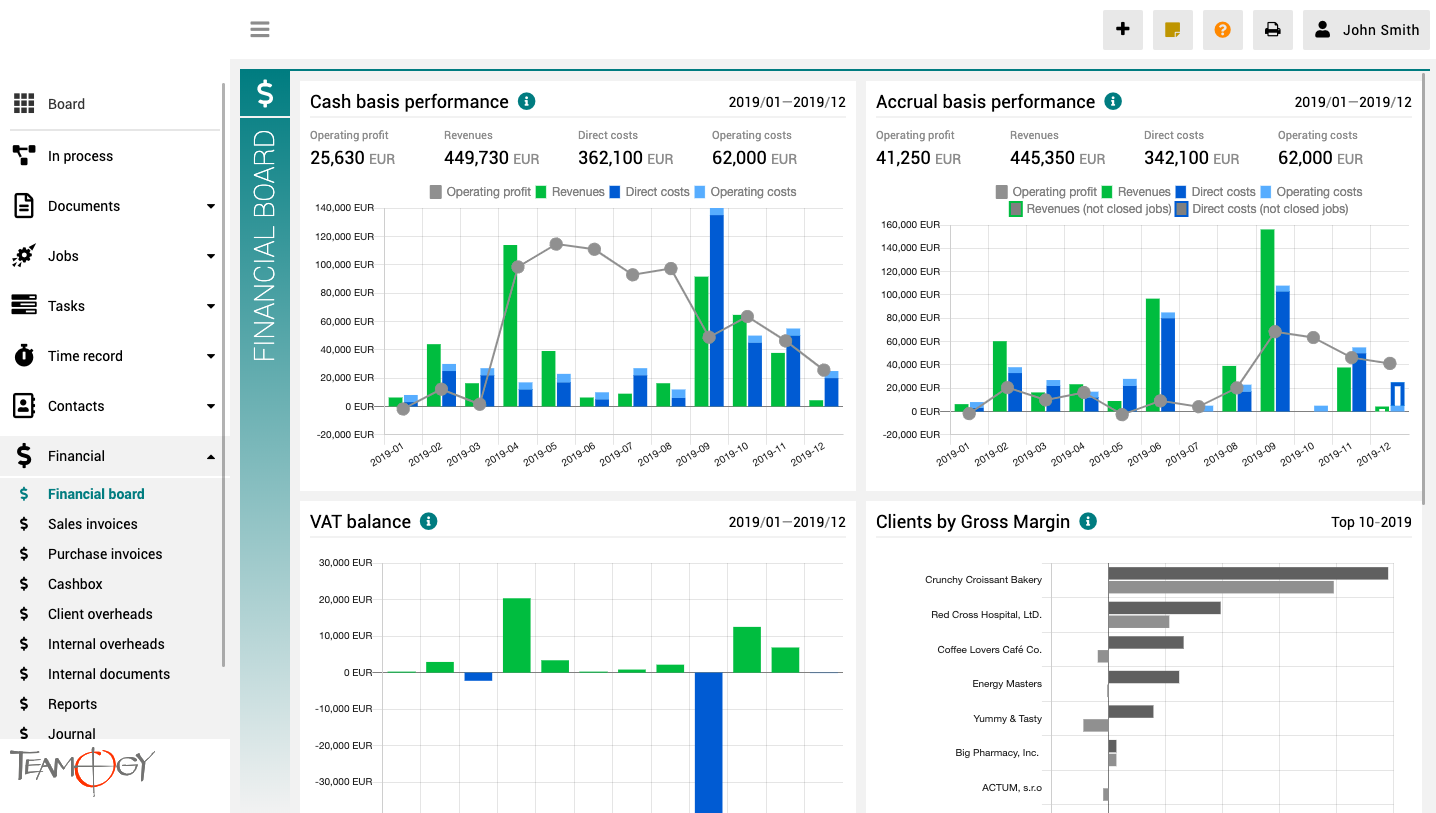
Pulpit finansowy to miejsce, które zapewnia wyraźny obraz całej agencji. Zawiera wykresy z kluczowymi wskaźnikami – ogólną ewolucję przychodów i kosztów agencji, zgodnie z aspektami finansowymi i jobu, różne poglądy na rentowność i wydajność klienta oraz raport VAT.
Wszystkie wykresy mają opcję wyboru zakresu dat, a dodatkowo raporty klientów mają również opcję monitorowania klientów najlepiej i najgorzej ocenianych.
How To Restart Process
How To Restart ProcessDo you have the problem, that you would like to restart the process? It is not the problem for the user with the related rights. Just click on the white dots in the process area. Then click on the Restart & Press Submit. Check the GIF below,...
Układ
Przełączanie się między jobami / Moimi jobami / moimi zadaniami / budżetami i wyszukiwanie
Filtry w liście zadań
O Timesheecie

Versión 2.16
Que es nuevo en la versión 2.16?
Funcionalidad principal: Comentarios
Mejoramientos: Tareas en Trabajo, Firma, Mejor Exportación de Trabajo, Buscar por ID de compañía, Pestañas Editables, Referencia de Contraparte/Número de factura
Version 2.15
What is new in 2.15 version?
Major Functionality: Stopwatch
Improvements: Composing documents from selected job items, New column in job table, Job Item creation driven by Quotation status
Bug fixes: Charts calculate also with operation billings
About Frequent Bad Habits
About Frequent Bad HabitsAlmost every company has some bad habits. We tried to describe some of them and at the same time to show them on graphic reports where they can be easily detected.Get in Touch If you have problem or need further assistance, do not hesitate...
About Financial Board
About Financial BoardThe finance board is a place that provides a clear view of the entire company. It contains charts with key indicators – overall evolution of revenues and costs of the company, according to financial and Job aspects, various views on client...
Jobs Are Not Closed Correctly
Jobs Are Not Closed Correctly The job is the basis of all operations at the company - it includes an approved quotation for the client, purchase orders placed to suppliers and Tasks for the internal team. All financial documents are related to the Job - it contains...
Get in Touch
If you still have any questions or need further assistance, feel free to contact Teamogy support. You can use Online chat (inside the Teamogy or anywhere on www.teamogy.com in bottom right corner) and you will receive a prompt reply.