Clients by EHP
This chart shows client rankings by Effective Hourly Payroll. This is a perfect criterion for measuring real client profitability.
Effective Hourly Payroll is calculated per client as Gross Margin divided by Recorded Hours in a selected period and is represented by the grey bar. The Yellow bar shows the number of Recorded Hours as additional information. On the horizontal axis is the number of Recorded Hours & the amount of EHP. On the vertical axis are the names of the Clients.
Gross Margin and Time Records for Effective Hourly Payroll calculation are taken only from Jobs that are closed or canceled in a chosen time period and from Client Overheads where Revenues and Costs are taken based on their accounting date, which belongs to a chosen time period and Time Records, which belong to a chosen time period.
Also, the BOTTOM profitable clients can be shown in the chart.
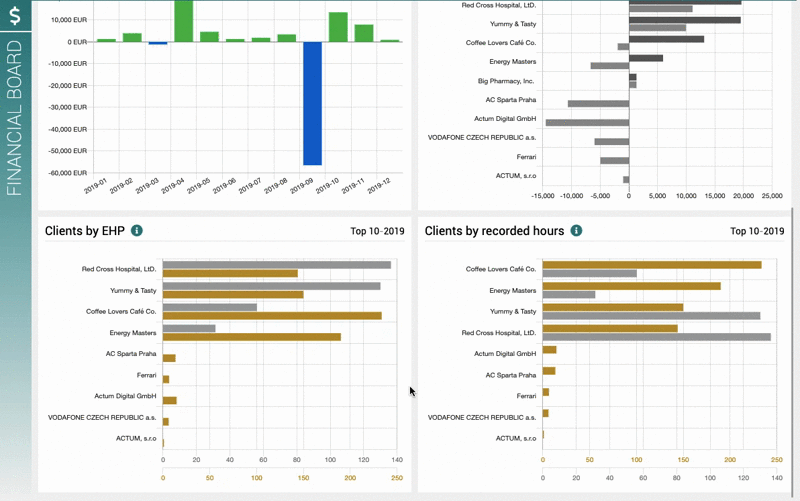
This chart is visible only for users in the following groups: Supervisor, Financial Supervisor and Finance.
The source for chart data can be found in:
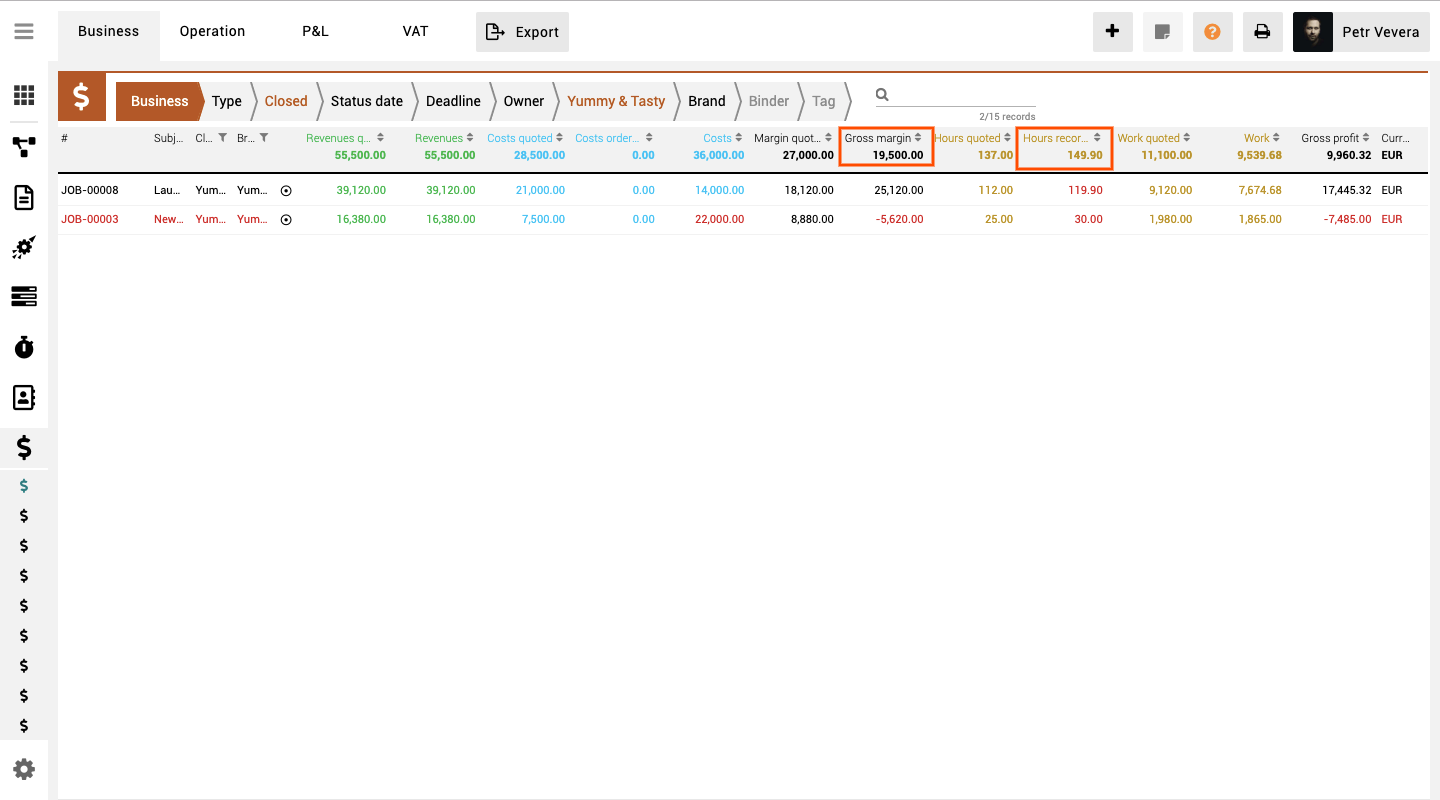
1. The business report for Gross Margin (Direct Revenues and Direct Costs) and Recorded Hours from Jobs. Use the proper filters (breadcrumbs) to see the relevant data (Job status=Closed, selected period, and selected client).
2. The P&L report for Direct Revenues and Direct Costs from Client Overheads. Use the proper filters (breadcrumbs) to see the relevant data (Date and Job type=Client overhead).
3. All of the Time records for hours reported to Client Overheads (Reported Hours). Use the proper filters (breadcrumbs) to see the relevant data (Date and Job type=Client overhead).
Get in Touch
If you have problem or need further assistance, do not hesitate contact Teamogy Support. Use online chat (inside Teamogy or everywhere on www.Teamogy.com in the lower right corner) and you will get prompt reply.