Accrual Basis Performance
Accrual basis performance helps to track company performance based on Jobs, Client Overheads, and Internal Overheads. This chart shows Revenues (green bar) and Costs (blue bar) for the selected months.
The chart locates both Revenues and Costs into the period, according to the date of the relevant Job. Revenues and Costs of one job are always in one period. If the Job is closed, its amounts are in the period of the Job closing date. If the Job is not closed, the amounts are in the period of the Job deadline. Revenues and Costs from Client Overheads and Internal Overheads (Operating revenues & costs) are located according to their accounting date.
The grey line represents a cumulated operating profit evolution in a chosen time period. Revenues and Costs are calculated only from valid financial documents.
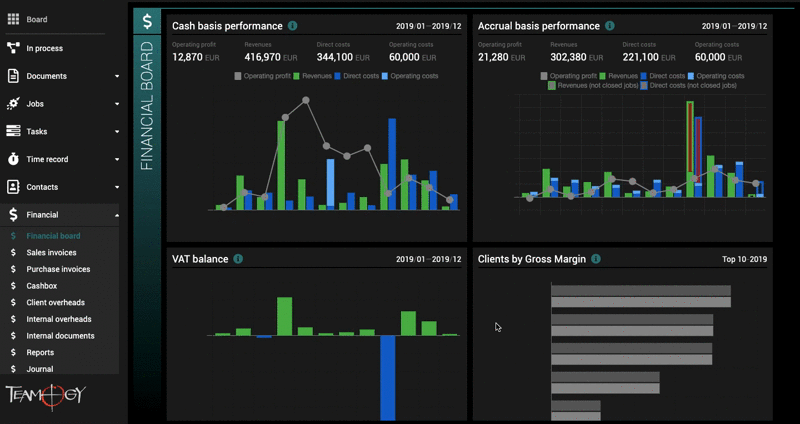
This chart is visible only for users in the following groups: Supervisor, Financial Supervisor and Finance.
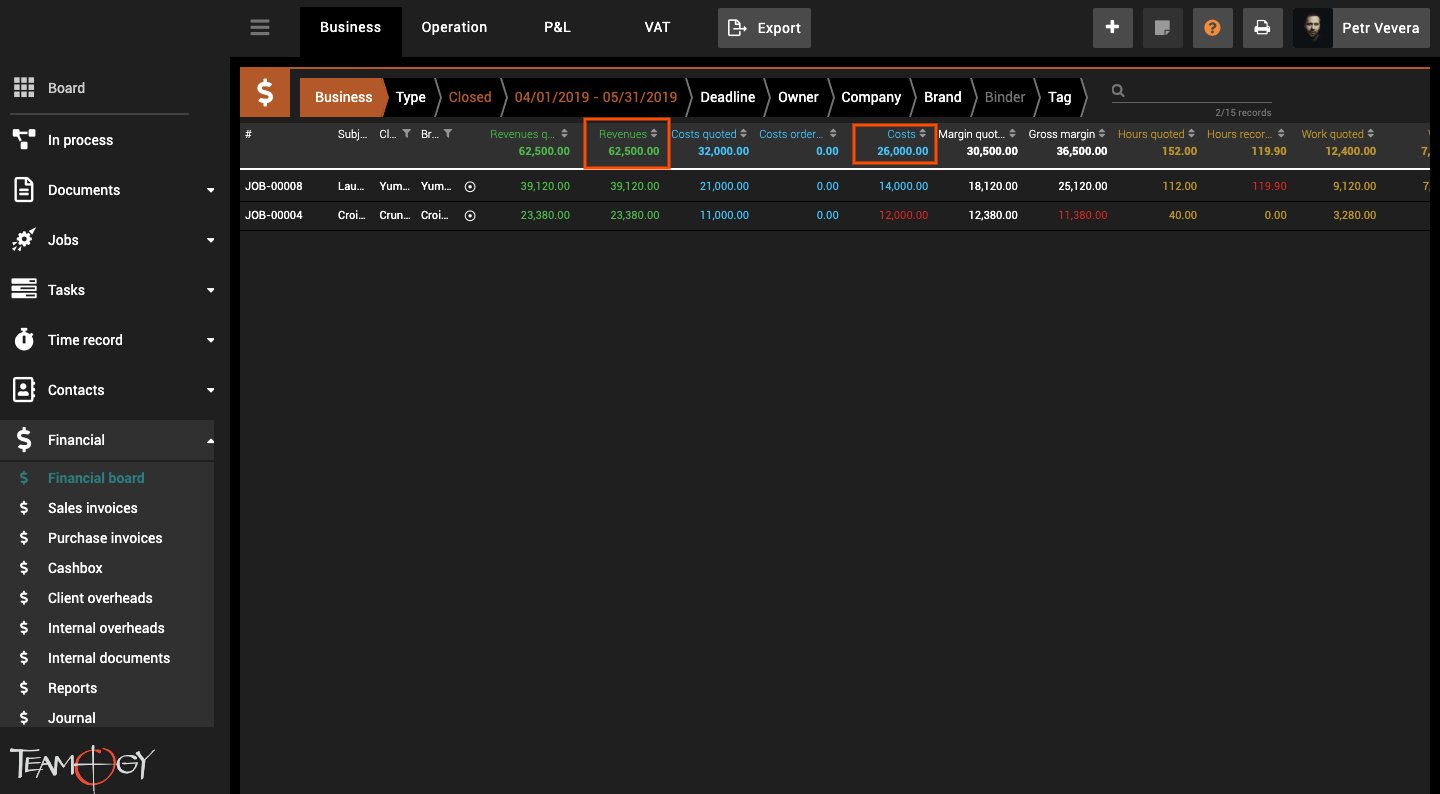
The Source for chart data can be found in:
1.) The business report for Direct Revenues and Direct Costs from Jobs. Use the proper filters (breadcrumbs) to see relevant data:
a) For Direct Revenues and Direct Costs from Closed jobs use filters Job status=Closed and chosen Date period.
b) For Revenues and Costs of Not-closed jobs use filters Job status=Not closed and chosen Date period.
2.) The P&L report for Direct Revenues and Direct Costs from Client Overheads. Use the proper filters (breadcrumbs) to see the relevant data (chosen Date period and Job type=Client overhead).
3.)The P&L report for Operating Revenues and Operating Costs from Internal Overheads. Use the proper filters (breadcrumbs) to see the relevant data (Chosen Date period and Job type=Internal overhead).
Get in Touch
If you have problem or need further assistance, do not hesitate contact Teamogy Support. Use online chat (inside Teamogy or everywhere on www.Teamogy.com in the lower right corner) and you will get prompt reply.