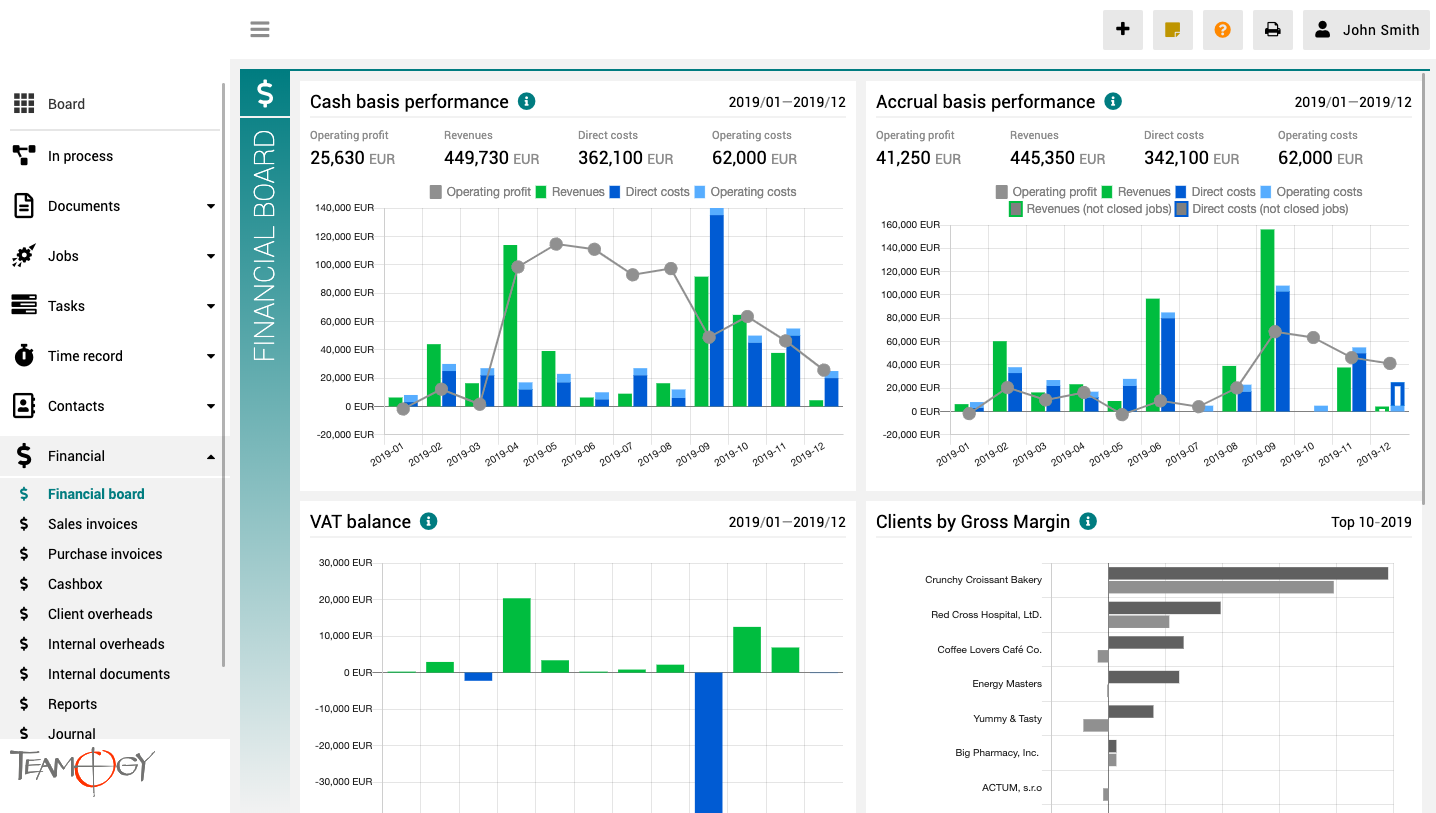
O Pulpicie finansowym
Pulpit finansowy to miejsce, które zapewnia wyraźny obraz całej agencji. Zawiera wykresy z kluczowymi wskaźnikami – ogólną ewolucję przychodów i kosztów agencji, zgodnie z aspektami finansowymi i jobu, różne poglądy na rentowność i wydajność klienta oraz raport VAT.
Wszystkie wykresy mają opcję wyboru zakresu dat, a dodatkowo raporty klientów mają również opcję monitorowania klientów najlepiej i najgorzej ocenianych.
Purchase Invoice
Purchase InvoiceTeamogy allows you to enter Purchase Invoices issued by your Suppliers. A Purchase Invoice is a basic type of Invoice that we receive from Suppliers. Check the GIF below to see how to compose the Purchase Invoice.There are a few details that are...
Purchase Prepayment Invoice
Purchase Prepayment InvoiceTeamogy allows entering a Purchase Prepayment Invoice from your supplier. Once you pay a Purchase Proforma Invoice, you can receive a Purchase Prepayment Invoice from your supplier. Check the GIF below to see how to create a Purchase...
Purchase Correction Invoice
Purchase Correction InvoiceTeamogy allows entering a Purchase Correction Invoice from your supplier. A Purchase Correction Invoice is for instances when your Supplier sent you an invoice that needs to be corrected. Correction Invoice can be modified by entering only...

Version 2.17
What is new in 2.17 version?
Major Functionality: Zoom
Improvements: Information bubble
Nowa Umowa
Nowa Umowa1. W rozwijanym menu po lewej stronie wybierz Dokumenty. 2. Kliknij w Moje Dokumenty lub Wszystkie Dokumenty. 3. Kliknij w Nowy dokument. 4. Wybierz Nowy dokument. 5. Uzupełnij wszystkie szczegóły.Pola obligatoryjne są podkreślone na czerwono (mogą być różne...
Kategorie
How To Restart Process
How To Restart ProcessDo you have the problem, that you would like to restart the process? It is not the problem for the user with the related rights. Just click on the white dots in the process area. Then click on the Restart & Press Submit. Check the GIF below,...
Układ
Przełączanie się między jobami / Moimi jobami / moimi zadaniami / budżetami i wyszukiwanie
Filtry w liście zadań
Get in Touch
If you have problem or need further assistance, do not hesitate contact Teamogy Support. Use online chat (inside Teamogy or everywhere on www.Teamogy.com in the lower right corner) and you will get prompt reply.